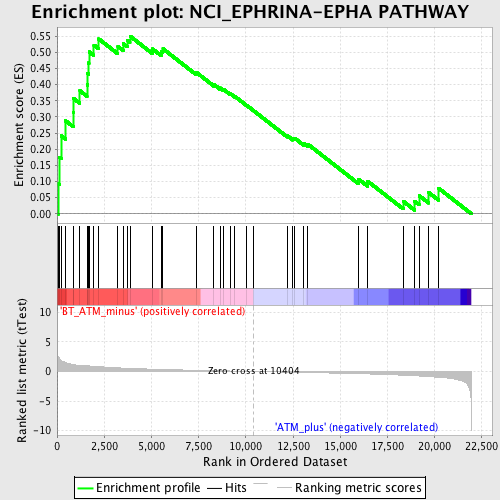
Profile of the Running ES Score & Positions of GeneSet Members on the Rank Ordered List
| Dataset | Set_02_BT_ATM_minus_versus_ATM_plus.phenotype_BT_ATM_minus_versus_ATM_plus.cls #BT_ATM_minus_versus_ATM_plus.phenotype_BT_ATM_minus_versus_ATM_plus.cls #BT_ATM_minus_versus_ATM_plus_repos |
| Phenotype | phenotype_BT_ATM_minus_versus_ATM_plus.cls#BT_ATM_minus_versus_ATM_plus_repos |
| Upregulated in class | BT_ATM_minus |
| GeneSet | NCI_EPHRINA-EPHA PATHWAY |
| Enrichment Score (ES) | 0.55029094 |
| Normalized Enrichment Score (NES) | 1.9387734 |
| Nominal p-value | 0.0 |
| FDR q-value | 0.088587984 |
| FWER p-Value | 0.227 |
| PROBE | DESCRIPTION (from dataset) | GENE SYMBOL | GENE_TITLE | RANK IN GENE LIST | RANK METRIC SCORE | RUNNING ES | CORE ENRICHMENT | |
|---|---|---|---|---|---|---|---|---|
| 1 | LCK | 1425396_a_at 1439145_at 1439146_s_at 1457917_at | 50 | 2.528 | 0.0936 | Yes | ||
| 2 | CRKL | 1421953_at 1421954_at 1425604_at 1436950_at | 122 | 2.239 | 0.1754 | Yes | ||
| 3 | FYN | 1417558_at 1441647_at 1448765_at | 216 | 1.850 | 0.2413 | Yes | ||
| 4 | VAV2 | 1421272_at 1435065_x_at 1435244_at 1458758_at | 453 | 1.509 | 0.2878 | Yes | ||
| 5 | PIK3CA | 1423144_at 1429434_at 1429435_x_at 1440054_at 1453134_at 1460326_at | 854 | 1.165 | 0.3137 | Yes | ||
| 6 | CRK | 1416201_at 1425855_a_at 1436835_at 1448248_at 1460176_at | 864 | 1.161 | 0.3574 | Yes | ||
| 7 | CBL | 1434829_at 1446608_at 1450457_at 1455886_at | 1207 | 1.030 | 0.3809 | Yes | ||
| 8 | HCK | 1446553_at 1449455_at | 1585 | 0.951 | 0.3997 | Yes | ||
| 9 | PIK3R1 | 1425514_at 1425515_at 1438682_at 1444591_at 1451737_at | 1613 | 0.946 | 0.4344 | Yes | ||
| 10 | EPHA6 | 1421527_at 1459369_at | 1669 | 0.933 | 0.4673 | Yes | ||
| 11 | ACP1 | 1422716_a_at 1422717_at 1450720_at 1450721_at | 1690 | 0.927 | 0.5015 | Yes | ||
| 12 | EPHA5 | 1420557_at 1437920_at 1444690_at | 1950 | 0.867 | 0.5226 | Yes | ||
| 13 | EPHA2 | 1421151_a_at | 2207 | 0.807 | 0.5415 | Yes | ||
| 14 | PLCG1 | 1435149_at 1450360_at | 3220 | 0.607 | 0.5183 | Yes | ||
| 15 | ROCK1 | 1423444_at 1423445_at 1441162_at 1446518_at 1450994_at 1460729_at | 3503 | 0.563 | 0.5268 | Yes | ||
| 16 | NGEF | 1448978_at | 3716 | 0.533 | 0.5374 | Yes | ||
| 17 | EFNA1 | 1416895_at 1448510_at | 3861 | 0.514 | 0.5503 | Yes | ||
| 18 | GRB2 | 1418508_a_at 1449111_a_at | 5050 | 0.386 | 0.5107 | No | ||
| 19 | VAV3 | 1417122_at 1417123_at 1446795_at 1448600_s_at 1458630_at | 5522 | 0.343 | 0.5022 | No | ||
| 20 | BCAR1 | 1439388_s_at 1450622_at | 5606 | 0.335 | 0.5111 | No | ||
| 21 | EPHA7 | 1427528_a_at 1443485_at 1445635_at 1451991_at 1452380_at | 7356 | 0.198 | 0.4388 | No | ||
| 22 | EFNA5 | 1421796_a_at 1436866_at 1440052_at 1446383_at 1451930_at | 8307 | 0.133 | 0.4004 | No | ||
| 23 | EPHA8 | 1419341_at | 8636 | 0.112 | 0.3897 | No | ||
| 24 | EPHA1 | 1422917_at 1432399_a_at 1432400_at | 8802 | 0.101 | 0.3860 | No | ||
| 25 | EFNA3 | 1431170_at 1455344_at | 9160 | 0.080 | 0.3727 | No | ||
| 26 | EFNA2 | 1417521_at 1444606_at | 9410 | 0.064 | 0.3637 | No | ||
| 27 | YES1 | 1418470_at 1449090_a_at 1456843_at 1458878_at | 10051 | 0.022 | 0.3353 | No | ||
| 28 | FGR | 1419526_at 1442804_at | 10416 | -0.000 | 0.3187 | No | ||
| 29 | EPHA3 | 1425574_at 1425575_at 1426057_a_at 1443273_at | 12194 | -0.110 | 0.2418 | No | ||
| 30 | SRC | 1423240_at 1450918_s_at | 12489 | -0.129 | 0.2332 | No | ||
| 31 | BLK | 1422775_at | 12579 | -0.135 | 0.2343 | No | ||
| 32 | ARHGEF15 | 1440358_at 1455522_at 1457172_at | 13060 | -0.165 | 0.2186 | No | ||
| 33 | CDK5 | 1422590_at 1450674_at | 13272 | -0.179 | 0.2158 | No | ||
| 34 | RHOA | 1437628_s_at | 15960 | -0.374 | 0.1072 | No | ||
| 35 | INPPL1 | 1460394_a_at | 16440 | -0.415 | 0.1011 | No | ||
| 36 | RAC1 | 1423734_at 1437674_at 1451086_s_at | 18330 | -0.627 | 0.0386 | No | ||
| 37 | PAK1 | 1420979_at 1420980_at 1450070_s_at 1459029_at | 18935 | -0.719 | 0.0383 | No | ||
| 38 | PTK2 | 1423059_at 1430827_a_at 1439198_at 1440082_at 1441475_at 1443384_at 1445137_at | 19172 | -0.759 | 0.0563 | No | ||
| 39 | EPHA4 | 1421928_at 1421929_at 1429021_at 1439757_s_at 1456863_at | 19681 | -0.858 | 0.0657 | No | ||
| 40 | TIAM1 | 1418057_at 1444373_at 1453887_a_at | 20197 | -0.980 | 0.0793 | No |

